为什么要对降水强度进行算法校正?
通过 Dirk Baker | 更新: 03/05/2021 | 评论: 0
博客主题


Product Category


搜索博客
订阅博客
出现新文章时获得邮件。选择您感兴趣的主题。
推荐文章
您是否想了解一个主题更多?请让我们知道。
In this article, I’ll explain how errors can occur when measuring the precipitation amount, discuss a correction approach, and demonstrate how an algorithm can be used to design high-quality tipping bucket rain gauges.
Introduction
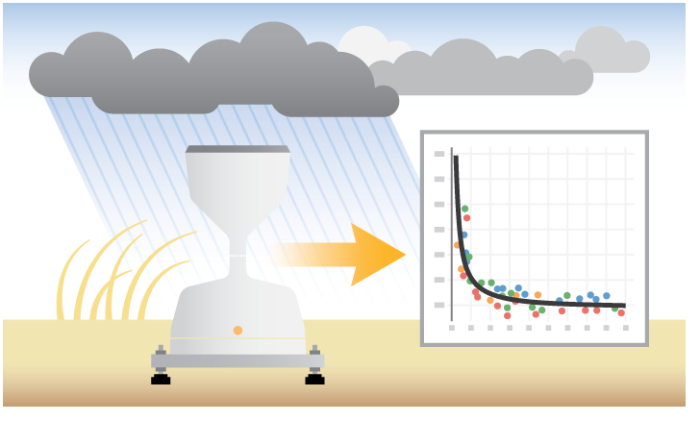
Liquid precipitation (rain) is at once one of the simplest measurements mechanically and electronically and one of the most difficult measurements to do well, accurately, and representatively. There are two ways of quantifying rainfall: amount—or accumulation—and intensity. Rain amount is reported as a depth in units of inches or millimeters and intensity in terms of amount per hour. Rainfall intensity is one of the largest contributors to error in measurement of precipitation amount.
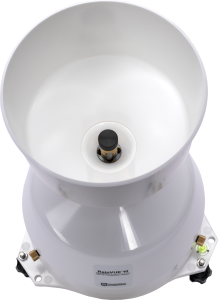
The most widely used type of rain gauge is commonly referred to as a tipping bucket. It has a tipping mechanism located underneath a funnel that is calibrated to tip back and forth as it is filled with a calibrated volume of water.
Not surprisingly, there is a limit to the speed at which the teeter-totter mechanism can tip back and forth before some of the water is lost and the measurement becomes increasingly inaccurate. Put another way, the accuracy of the measurement of rain accumulation depends on the rate, or intensity, of rainfall.
Another significant source of error for liquid precipitation in general is wind, sometimes accounting for as much as 20% loss. The distinctive hourglass shape of the RainVue™ series of precipitation gauges is specifically designed to mitigate the influence of wind on catchment, and there’s evidence* that it is effective.
At Campbell Scientific, we have developed a correction algorithm for intensity and integrated it into the RainVue series of smart rain sensors. In the remainder of this article, I’ll describe the approach we’ve taken to develop and test that algorithm.
The Process
Most tipping bucket rain gauges are very simple electronically—every tip causes a switch to close, and those switch closures are counted by a data logger. This means two things for intensity:
- We need to do more than just count tips.
- The rain gauge needs something added to make the additional measurements (i.e., timing) and calculation.
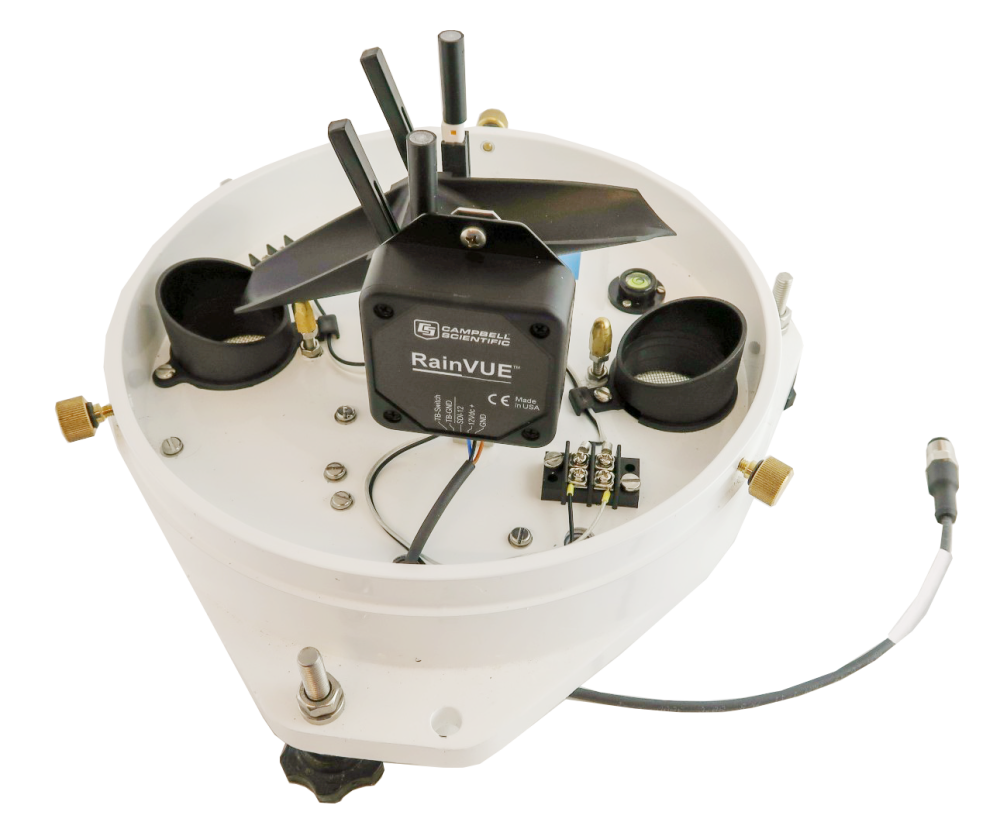
All of this could be put into the program run by the data logger. However, for simplicity and ease-of-use, we’ve added a module to the gauge to do the calculations and communicate the data to a logger via SDI-12, so there’s no complicated program for the user to create or maintain. The module can also serve as a backup for the data and continue operating for a time on the internal battery should communications and power from the data logger be lost.
|
Recommended for You: For more information, watch the RainVue 20 video. |
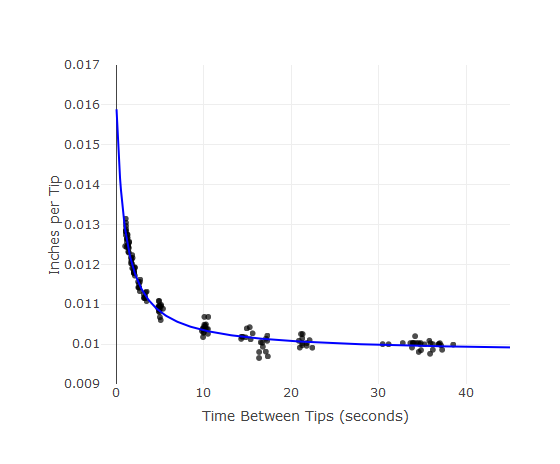
One approach to correcting for intensity is to first calculate intensity (amount per hour). Then, from intensity, calculate a correction for amount. We chose a more direct route for correcting accumulation or amount for intensity by measuring the time between tips (TBT) and using that as the predictor for the amount of rain per tip. From TBT and amount, intensity is calculated through simple unit conversion.
Data Collection and Model Development
We used 10 new tipping buckets of each RainVue model for data collection. Each bucket was run through three replications at each of 12 to 16 fixed rates of simulated rainfall (depending on the model and targeted range of intensity correction). Rainfall was simulated simply by running measured volumes of de-ionized water through high-precision nozzles.
- For rates greater than 100 mm/hr, sufficient water was passed through each bucket to achieve 1,000 total tips for each replicate.
- For the lower rates, a minimum of 330 tips was used for each replication.
(With our test fixtures, we could run up to four buckets simultaneously, but data collection alone required approximately 1,000 hours or more for each of the RainVue models!)
With the known volume quantity and accurate measurements of the number of tips and TBT using CR6 dataloggers, we had all the data we needed to develop our correction models. Using regression, several models were compared for fit. Example functional model forms include power-law and exponential decay, among others. Accuracy was tested by competing the models against each other both via cross-validation and collecting new data.
The figure below shows an example of raw data along with one of the candidate models we considered (e.g., power-law, exponential decay, others):
Conclusion
Overall, this project has been an interesting challenge, and I hope this article provides some insight into the development process as well as demonstrates the strong methods used to create the best possible algorithm to add value to high-quality tipping bucket rain gauges.
If you have any questions about the algorithm, please post them below.
*References
https://agupubs.onlinelibrary.wiley.com/doi/full/10.1002/2017WR020549
https://agupubs.onlinelibrary.wiley.com/doi/full/10.1029/2017WR022421


关于作者
 Dr. Dirk V. Baker was a Senior Scientist and the Global Science Program Manager at Campbell Scientific. His areas of interest included ecology, agriculture, and meteorology—among others. He has a bachelor's degree in wildlife biology and a doctorate in weed science, both from Colorado State University. Dirk’s graduate and postdoctoral research centered around measuring and modeling wind-driven plant dispersal.
建议
Please log in or register to comment.