Death Valley, a Year Later
通过 Dirk Baker | 更新: 07/29/2022 | 评论: 9
博客主题


Product Category


搜索博客
订阅博客
出现新文章时获得邮件。选择您感兴趣的主题。
推荐文章
您是否想了解一个主题更多?请让我们知道。
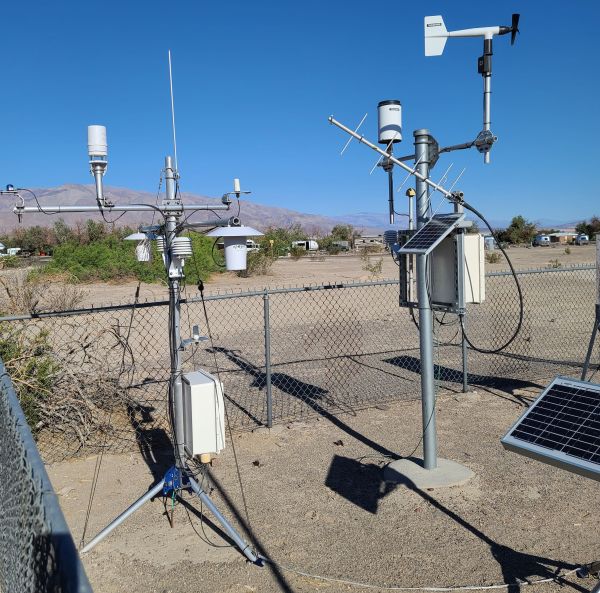
About a year ago (May 2021), I installed a weather station next to the National Weather Service’s (NWS) official station at Furnace Creek in Death Valley National Park (California, USA). To familiarize yourself with this project, read my previous article. The purposes of this installation and the collaboration with both NWS and the National Park Service (NPS) were to provide additional temperature measurements for comparison with the official temperature and to co-locate comparable sensors that would be possible replacements for the discontinued CS215-L Digital Air Temperature and Relative Humidity Sensor currently in use on the official station.
This collaboration was initiated because of the high temperature measurement recorded in August of 2020. While the sensor that was in use at that time is still being evaluated, there are some interesting results of the collaboration that I can share.
What about the co-located data?
As mentioned in my previous article, the station I installed includes sensors in both active (fan-aspirated) radiation shields and passive shields. Two of those sensors were HygroVue™5 Digital Temperature and Relative Humidity Sensors—one in a passive shield and one in an active shield. This sensor is the direct replacement for the CS215 (also in a passive shield) installed on the NWS station. In addition, a 109 Temperature Probe was installed in a passive shield, and three replicate thermistor beads were installed in an active shield. The beads and 109 compared well to a high-accuracy platinum resistance thermometer (PRT) in a liquid bath at 50, 55, and 60 °C. My thinking was that the beads—mounted in an active shield—would provide the highest accuracy measurement of air temperature against which to compare the rest of the measurements. This thinking was not wrong, but there are some key caveats.
What qualifies as an extreme?
Before going into any detail on the data from the summer of 2021, I want to go over some bigger-picture ideas.
One consideration is what might be called “representativeness.” A sensor may measure the conditions immediately around it very accurately, but if those conditions don’t represent a broader area of interest, absolute accuracy may be less relevant. Carefully selecting the location (or siting) for a weather station and mounting the sensors at or near two meters above ground help address the question of representativeness.
There are several factors that contribute to the accuracy, or lack thereof, of an air temperature measurement. The most important of these are exposure to solar radiation and the impacts of wind. As I mentioned in my previous article, a standard (passive) radiation shield reduces the effects of solar radiation on the measurements, but during times of low wind speed, an upward bias can result from lack of air movement around the sensor. Therefore, a fan-aspirated or active radiation shield is considered the best available method for an accurate air temperature measurement. Of course, at the level of electronics, the sensor and data logger contribute to uncertainty in the measurement as well. However, these uncertainties are typically on the order of tenths of a degree Celsius rather than the several-degree bias that can result from solar radiation.
Comparing measurements in space or over time is complicated by all these factors, as well as one more that varies from sensor to sensor: how quickly the sensor equilibrates to changes in ambient conditions. This is quantified with something called the time constant. In brief, the time constant for a given temperature sensor is quantified in a lab setting by subjecting the sensor to an instantaneous step change, usually of several degrees. The time constant, represented by the Greek letter τ (tau), is defined as the time for the measurement to come to 63% of that step change at some known wind speed1,2,3. Due to the nature of that equilibration curve, it takes about three times τ for the sensor to adjust to 95% of that change. The World Meteorological Organization (WMO) recommends a time constant of 20 seconds at 1 m/s wind speed for air temperature measurements1.
What about processing data for recording extremes?
Remarkably—given the importance we see as a society in extremes—there do not seem to be widely accepted standards for what it takes to be an extreme or how to quantify it. Most data loggers, unless explicitly programmed otherwise, will simply record maxima and minima as the highest or lowest single measurement over a given interval (hourly, daily, etc.). Note that one might be tempted to call these “instantaneous” measurements, but the time constant makes this incorrect. If an accurate sensor has a fast response (short time constant), then its maximum recorded temperature over a given hour may be accurate, but what does it actually represent? Is that measurement important? That really depends on how those measurements are to be used. For reference to what a human would perceive, it may not be very important.
Some level of data processing for recording extremes seems appropriate for measurements such as wind and air temperature, among others. Indeed, the WMO1,4 does have a processing recommendation for temperature that is based on their recommendation of a sensor with a 20-second time constant. This recommendation is to sample the sensor four times per time constant and average those measurements once every minute. This then becomes the sample. This implies that maxima and minima are then calculated from those one-minute averages. Indeed, using this one-minute average for maxima is recommended by the WMO’s Automatic Weather Station (AWS) Tender Specification4. While this makes sense, there are many sensors in use around the world, particularly temperature and relative humidity sensors, that have a time constant that is much greater than 20 seconds. Neither the station I installed nor the NWS station at Furnace Creek does this kind of processing; however, all the raw data are stored, so we can do post-processing.
OK, but really, what about the co-located data?
Finally, we’re getting to some of the results from the 2021 summer data collection!
As you might imagine based on the above information, there are a lot of nuances and caveats to comparing all the data we have from the two co-located stations. I presented a poster (“Measurement and Uncertainty in Death Valley Temperatures”) at the American Meteorological Society Annual Meeting in January 2022 that goes into more detail, including figures and tables that show the station setup, but here are some highlights.
On July 9, 2021, at approximately 4 p.m. local time, the NWS station reported a maximum temperature of 54.4 °C (130 °F), which, like the temperature reported in August of 2020, would be a record. Looking more closely at those data (see Figure 1a), there is a relatively short-duration spike in temperature of about 2 °C.
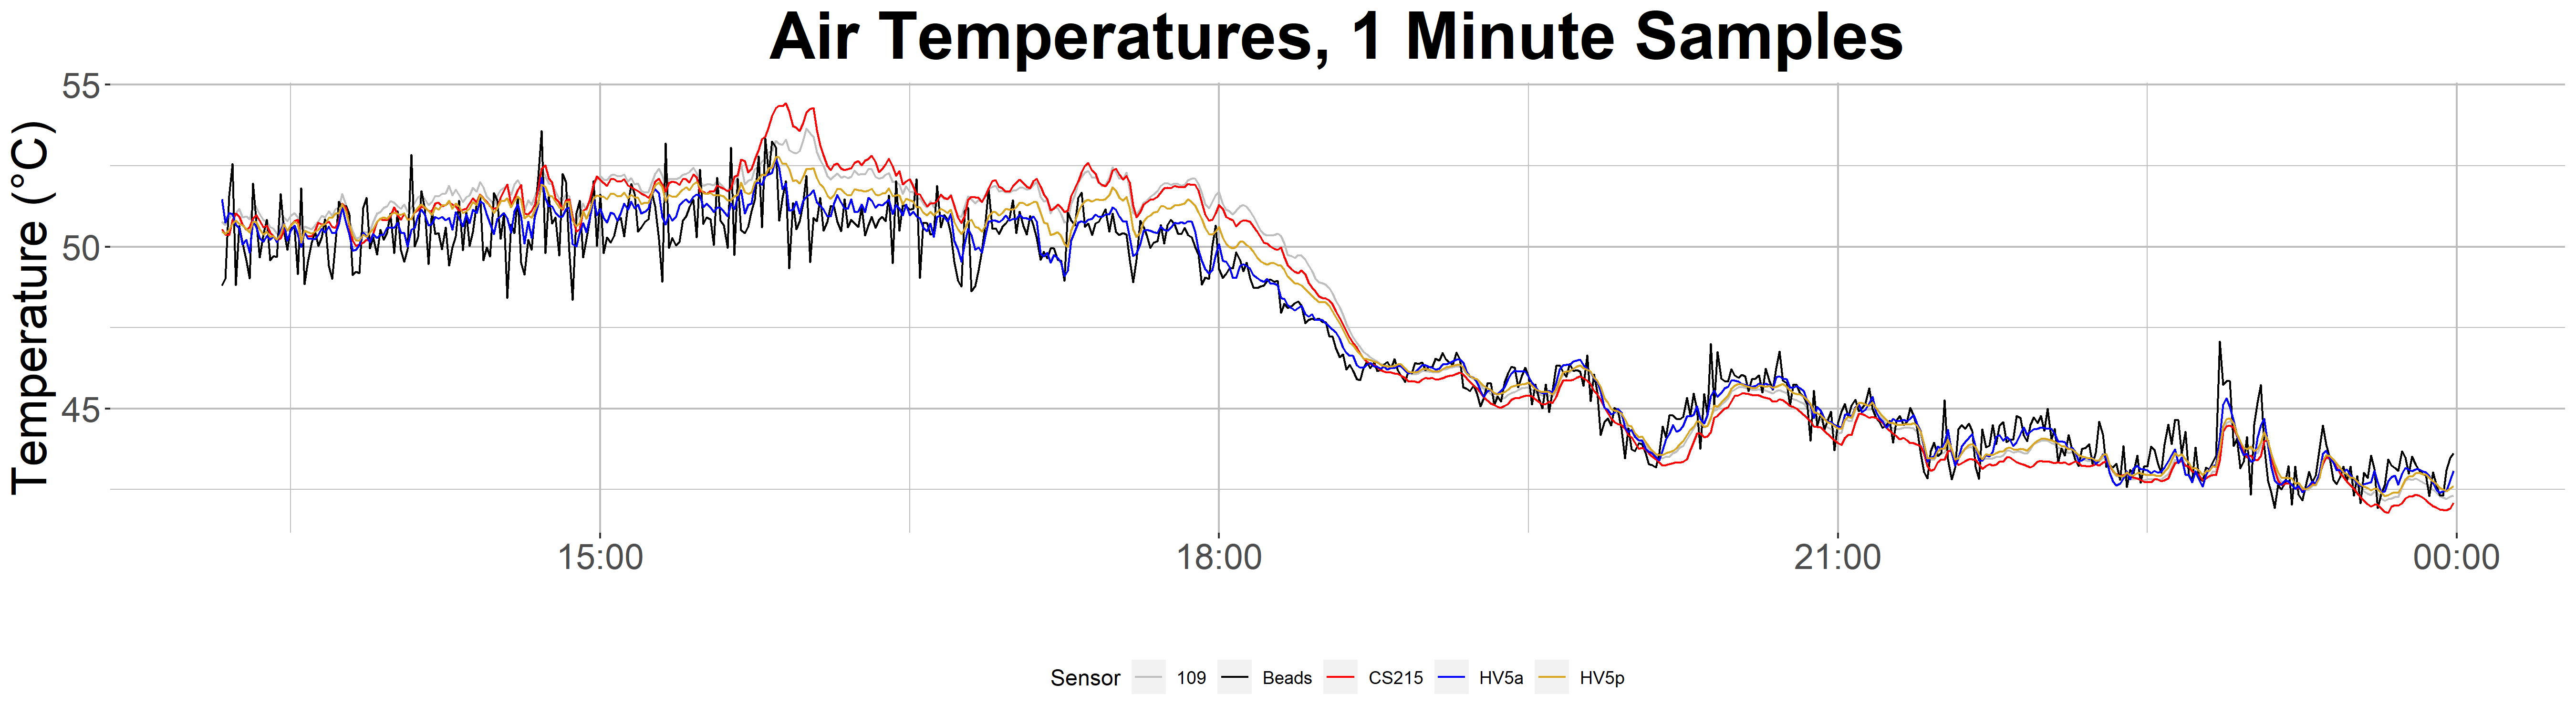
Figure 1a: Click the graph for a larger image.
If we only had the data from the NWS station, this would be suspicious. However, a spike of similar magnitude is shown in the data from the sensors (all seven of them!) on the station I installed. In addition, that spike is also evident after processing the raw data to ten-minute averages (Figure 1b).
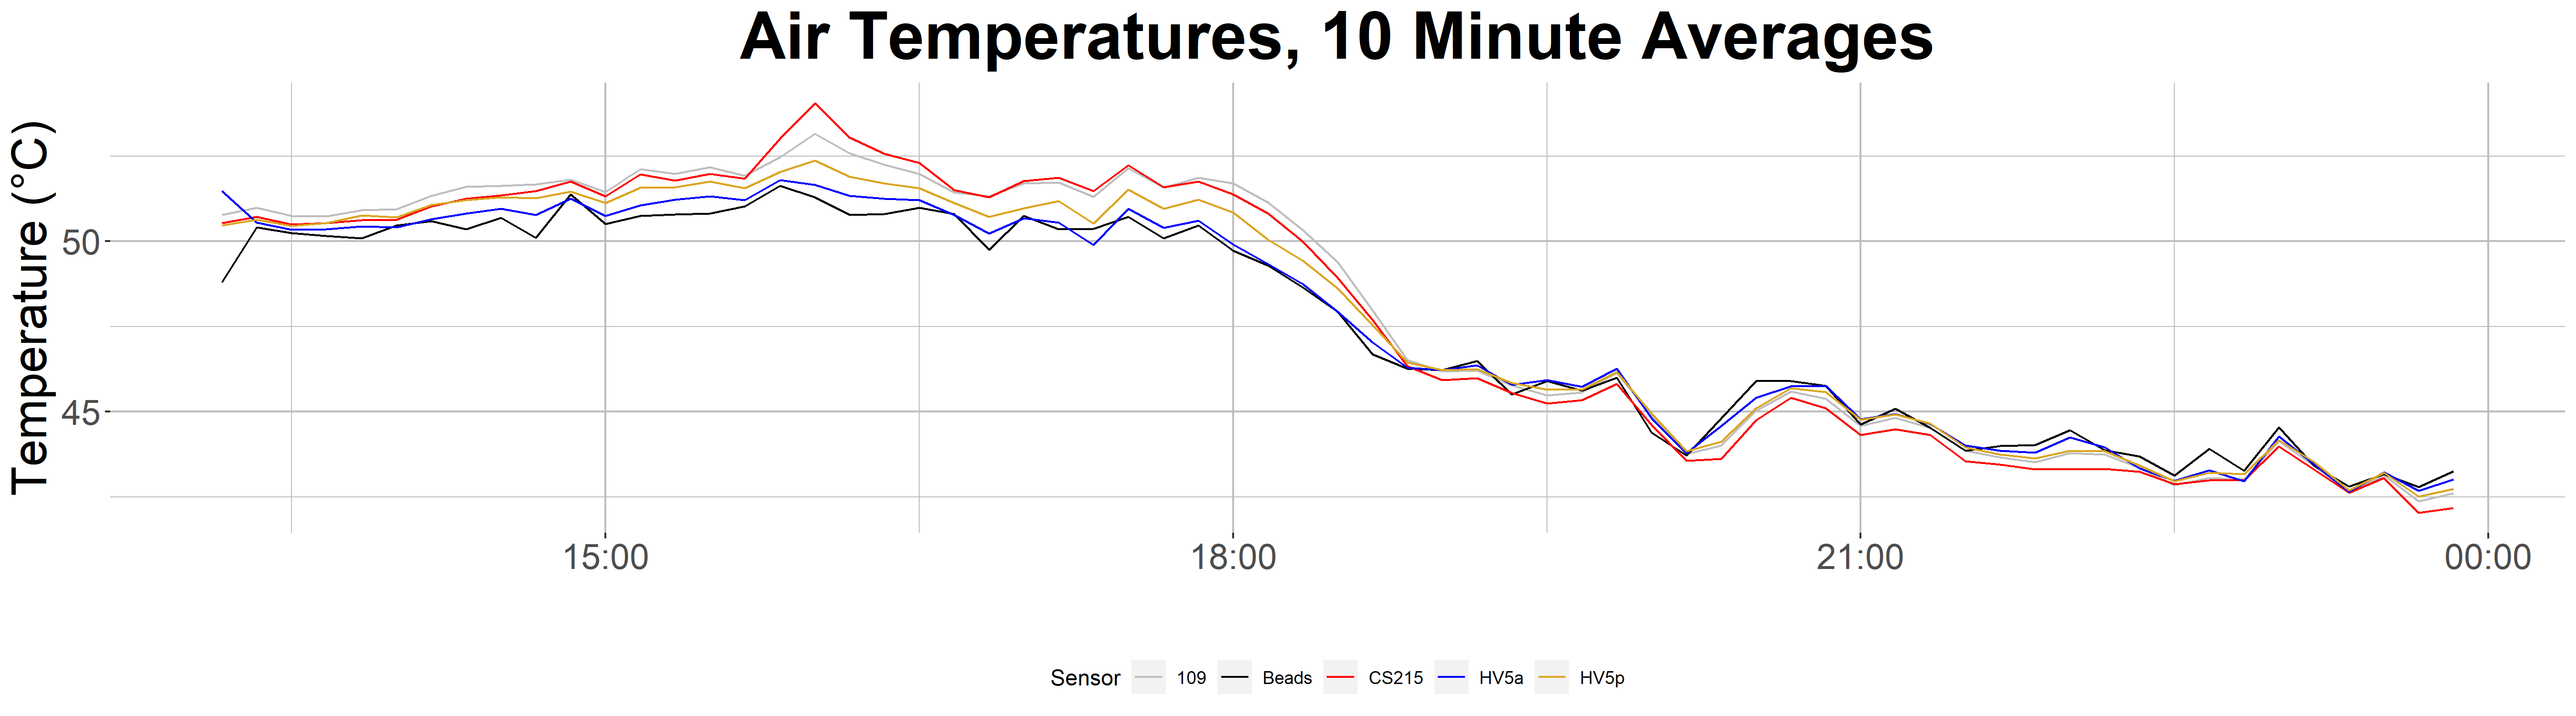
Figure 1b: Click the graph for a larger image.
Therefore, the spike seems to be a real phenomenon, though I’m unsure of the cause and am interested in any ideas. (Please don’t hesitate to add comments to this article or contact me directly). All that said, the measurements on the station I installed were noticeably lower than that on the NWS station. The closest was the 109 probe at 53.6 °C (128.5 °F) comparing raw, one-minute measurements. So, the record-breaking number is not supported by the co-located measurements.
More generally, looking at a full year of data beginning in mid-May 2021, there are some interesting results. As mentioned earlier, the temperature and relative humidity sensor model that has been used by the NWS (CS215) has been retired, and the direct replacement is the HygroVue 5, which fits in the aspirated radiation shield (TS100SS Aspirated Radiation Shield). Comparing the overall average difference and its standard deviation (SD) between the CS215 on the NWS station and the HygroVue 5 in a passive radiation shield shows strong agreement, but with an interesting difference at night (Table 1). At night, the HygroVue 5 is about 0.25 °C warmer, on average, than the CS215. This difference is puzzling, and I don’t have a clear explanation for it.
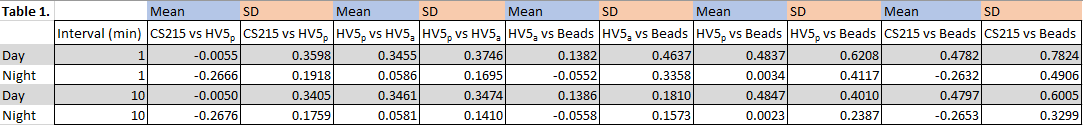
Table 1: Click the table for a larger image.
Another interesting comparison is the two HygroVue 5 measurements (in passive and aspirated radiation shields) and the thermistor beads in an aspirated shield. I used the average of those three beads as what I’m considering the measurement of the highest accuracy. At night, unsurprisingly, all three of these compare very well (Table 1). During the day, the aspirated HygroVue 5 shows an upward bias, but within a generally acceptable range. The HygroVue 5 in a passive shield, however, shows a notably larger positive bias, which is similar to that of the CS215. The variations of these differences are the greatest of all the comparisons in Table 1.
What’s next?
Originally, I had planned to take the station down after the 2021 summer season. In conversations with my collaborators, we decided to leave it up for at least another summer. I returned to Death Valley in early April 2022 to check on the station, do any necessary maintenance, and make two key changes. One change was to add a thermistor bead to the passive shield where the 109 probe is located. This gives us a direct comparison in terms of time constant between the aspirated and passive shields. The other change was to store raw five-second measurements on the NWS station so we can do deeper evaluations related to time constants.
I hope you’ve found this article informative, and I’m looking forward to seeing the results of this 2022 season. If you have any ideas about the cause of the noted temperature spike, please post them below or contact me directly at dbaker@campbellsci.com.
References
1CIMO Guide 8. WMO Guide to Meteorological Instruments and Methods of Observation. https://community.wmo.int/activity-areas/imop/cimo-guide
2Instrument Engineers’ Handbook: Process control and optimization. https://www.google.com/books/edition/Instrument_Engineers_Handbook_Volume_Two/TxKynbyaIAMC?hl=en&gbpv=1&printsec=frontcover
3Electronics Tutorials: Tau – The Time Constant: https://www.electronics-tutorials.ws/rc/time-constant.html
4IOM-136. Generic Automatic Weather Station (AWS) Tender Specifications. https://library.wmo.int/records/item/57830-generic-automatic-weather-station-aws-tender-specifications


关于作者
 Dr. Dirk V. Baker was a Senior Scientist and the Global Science Program Manager at Campbell Scientific. His areas of interest included ecology, agriculture, and meteorology—among others. He has a bachelor's degree in wildlife biology and a doctorate in weed science, both from Colorado State University. Dirk’s graduate and postdoctoral research centered around measuring and modeling wind-driven plant dispersal.
建议
Bill Reid | 08/06/2022 at 03:51 AM
Hello, Dr. Baker, Thank you for the very informative comparisons! Much of what you address, especially with regard to the "representativeness" of the station and the measurements, is precisely what I discuss in some of my DV entries on my web site. The exposure of the current DV station has been declining through the previous several decades due to an increase in "stuff" and vegetation nearby, especially to the south of the instrumentation. Afternoon winds in summer are usually from the south. The decrease in natural ventilation at the station site has resulted in a significant increase in average maximums in summer at DV. If I can post a link to my article on this issue ---
https://stormbruiser.com/chase/2020/08/17/august-17-2020-the-continued-decline-in-exposure-of-the-death-valley-weather-station/
The spike in temperature (to 130F) on July 9, 2021, on the CS 215 is very likely a product (to some extent) of the rather inadequate ventilation through the station. The "spike" occured during a time of very light wind and during what is normally the hottest time of the afternoon. When the wind subsides in and around a locale which is already somewhat wind-protected, the hot air right above the bare ground is allowed to build higher than it otherwise would be able to build. Temperature at sensor level comes up some. It would be interesting to see minute-by-minute wind speed and direction data at DV/Furnace Creek during the 4-5 p.m. timeframe on July 9th. What was the wind direction during the "spike?" Was it drifting from the east, off of the area of the parking lot and solar panels? Are the small solar panel and/or the metal supports very near the CS215 radiation shield promoting excessive temperature measurements when wind is drifting very slowly off of those heated devices?
Here is my analysis of the heat wave of July 2021 in DV and the region:
https://stormbruiser.com/chase/2021/10/07/death-valley-july-2021-heatwave-analysis/
July 10 was actually hotter in the region as a whole versus July 9 (2021), but that lull in the wind and the spike in temperature at DV on the 9th caused the slightly hotter maximum there on the 9th.
Hope this helps some. I think the bottom line is that there was a natural lull in the winds which allowed a jump in temperature on the 9th, and the somewhat wind-protected station site and the bare ground "super-sized" the spike.
Bill Reid
Lawrence | 08/06/2022 at 11:18 PM
The data on the DCP HADS site for July 9, 2021 has the wind speeds and direction listed on the top of each hour. I don't know if these are averages or just at that specific time. At 23:54 the 130.00°F was recorded. At 0:00 a wind speed of 0.03 mph and direction of 159.6 (SSE) was listed.
Dirk | 08/10/2022 at 05:33 PM
Thank you both for your comments! Others have also suggested hotter air from the parking area or solar panels may help explain the spike.
Lawrence | 04/18/2023 at 02:44 PM
Any updates on the 2022 data?
Thanks,
Larry
Dirk | 04/20/2023 at 06:27 PM
Hi Larry,
Thank you for the comment - I have not yet done additional deep dives into these data. There are some things in the works, but I don't have a timeline that I can share yet.
Best,
Dirk
Lawrence | 05/12/2024 at 02:18 PM
Is the Campbell station still active at the Furnace Creek site? It's too bad that there isn't a website like you have for the Peter Sinks site. The hottest and coldest (if you exclude Mount Rainier) spots in the continental US would then both have accurate data.
Thanks,
Larry
Dirk | 05/13/2024 at 04:44 PM
Hi Larry - thank you for the note! It is still in operation and we added some things to it, including the new TempVue20 sensors. It would be nice to have real-time data available. However, with the ownership somewhat shared between NPS and NWS and the controversial nature of the site, this is not possible at this time.
Also, to clarify, while the equipment for Peter Sinks is provided by Campbell Scientific and Apogee Instruments, the station and it's website are operated and maintained by Utah State University.
Best,
Dirk
Bill Reid | 07/30/2024 at 04:06 AM
Hello again, Dirk! I visited the DV site on July 9th, 2024 and saw your equipment in the weather station "corral." It appears that, due to power outages, the official station has missing max and min temperature data for a few days in mid-July. Does your station equipment have uninterrupted data or would there be a similar loss of data if the power to the station was cut?
Dirk | 07/30/2024 at 03:56 PM
Hi Bill,
Thanks for your note! Both stations are on independent power - battery with solar charging. It's my understanding that the NWS official station had a battery failure, but there is no interuption in the data from the station I installed. The NWS has been in touch with me about using data from 'my' station for gap-filling, so we should be able to do a reasonable job of reconstructing missing data. I don't have direct access to the raw data from the NWS station, but these stations will typically operate during clear days on the solar panel. So the maxima may be recoverable directly.
I can't say how soon results will be publicly available - I'm sure NWS will want to do careful review and analysis.
Best,
Dirk
Please log in or register to comment.